Birds of the Upper Cumberland Region: Species Accounts
Eastern Whip-poor-will (Antrostomus vociferus)
|
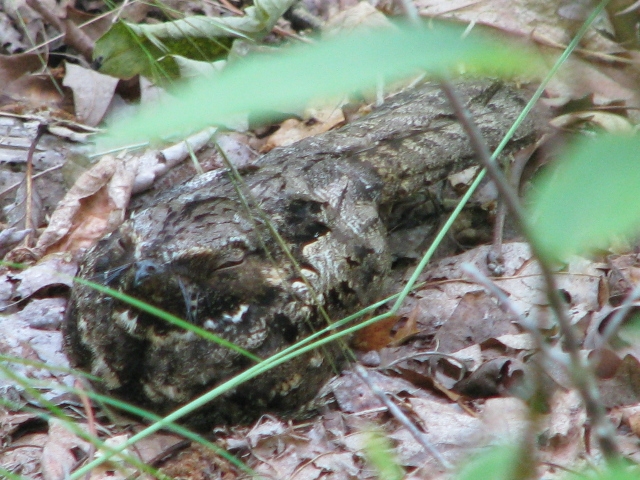
Eastern Whip-poor-will [incubating adult]. Photograph Credit: DJ Stanely; Mayland, Cumberland County, Tennessee; 2 June 2009.
—
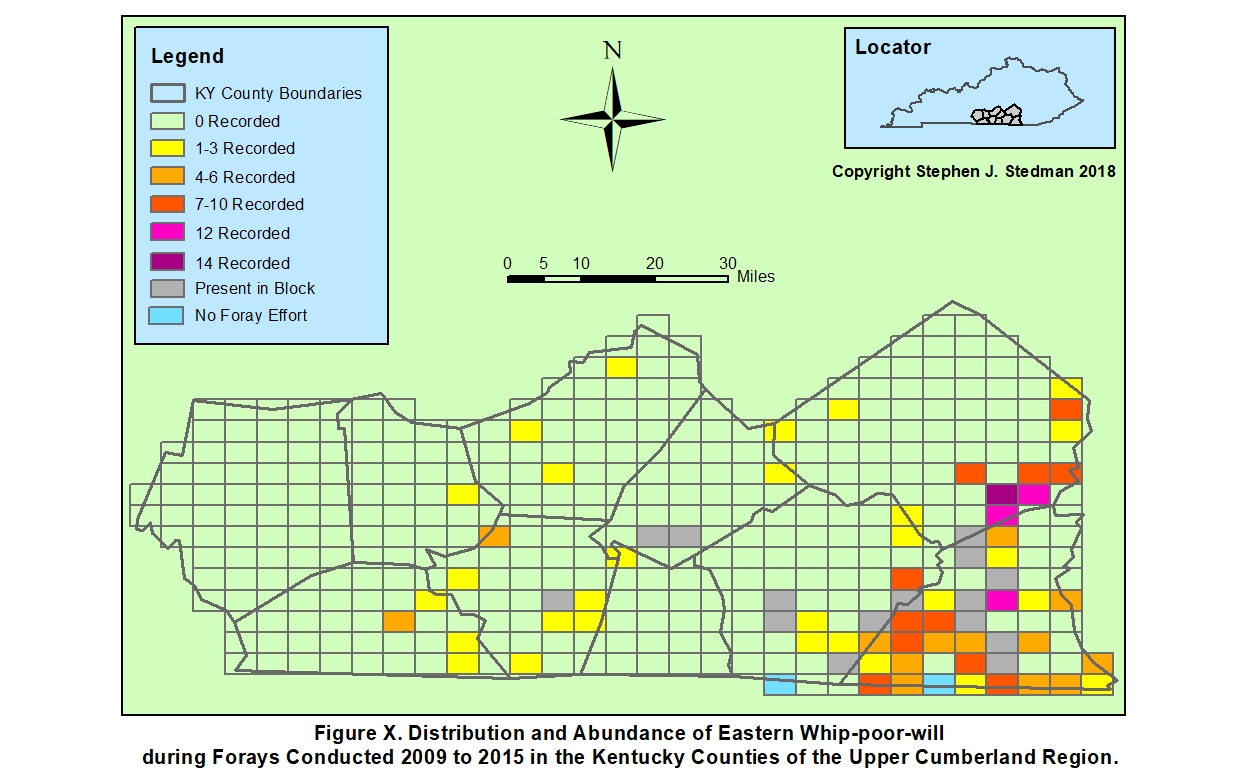
Abundance: Uncommon from early spring through summer and into mid-autumn; recorded in all Regional counties (Map of UCR Distribution); the trend in the Region is probably negative, but in areas where habitat has not been unduly degraded (e.g., Big South Fork National River and Recreation Area), population densities may remain relatively stable (LINK to Regional Bird-Monitoring Plan).
Status: Summer Resident; photograph (see above).
Regional High Count and SBC/SBB High Count: 64 (2 May 2009; Cumberland County, Tennessee [SBC]; m. ob.).
Regional Extreme Dates:
Early Spring: 17 March 2012 (Bullington Lane, Jackson County, Tennessee; Nancy S. Layzer, James Layzer).
Late Fall: 4 October 1889 (Pulaski County, Kentucky; observer unknown; Mengel 1965).
Note: Spring arrival usually widespread by 20 April; fall departure largely complete by 20 September. Regional dates of earliest reported spring arrival and latest reported fall departure for the years 2002–2011 follow:
| Year | Early Spring Arrival | Late Fall Departure |
| 2002 | 11 April | -- |
| 2003 | 29 March | -- |
| 2004 | 3 April | 25 September |
| 2005 | 4 April | 24 September |
| 2006 | 1 April | 17 September |
| 2007 | 29 March | 27 September |
| 2008 | 6 April | 20 September |
| 2009 | 26 March | 19 September |
| 2010 | 2 April | 2 October |
| 2011 | 7 April | -- |
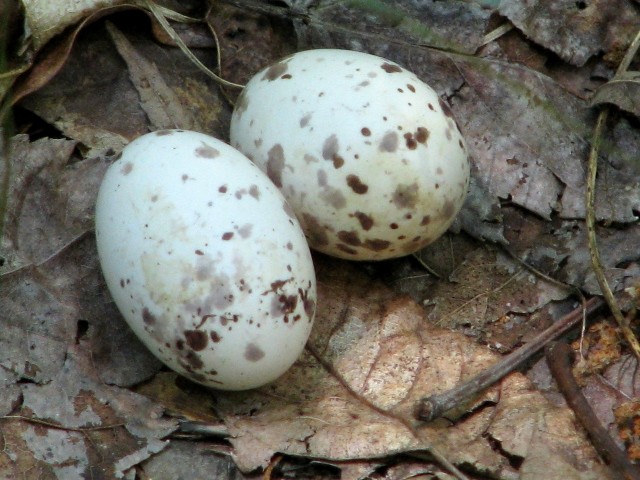
Breeding: Confirmed (Recent). The "nest" of this species is simply a shallow depression in leaf litter; the clutch is almost always comprised of 2 eggs, illustrated in this photo (DJ Stanley; Cumberland County, Tennessee; 2 June 2009). This ground nester is quite susceptible to disturbance by free-roaming pets, of which many thousands are probably present in most Regional counties.
Habitat: Higher density populations are often associated with fairly mature mixed forest and particularly with extensive pine plantations on the Hartselle Bench and especially on the Cumberland Plateau; lower density populations are often associated with mixed forest, or even predominately deciduous forest, near the rim of the escarpment between the Highland Rim and the Central Basin.
YardWatch Results 2003 and 2004: registered on 9 (of 125) monthly check-lists during 2003 and on 19 (of 206) check-lists during 2004, leading to YardWatch frequency classifications of Very Uncommon and Uncommon, respectively; this caprimulgid was a bit less likely to be encountered in Regional yards and neighborhoods than in the Region as a whole, a not too surprising result of the YardWatch project.
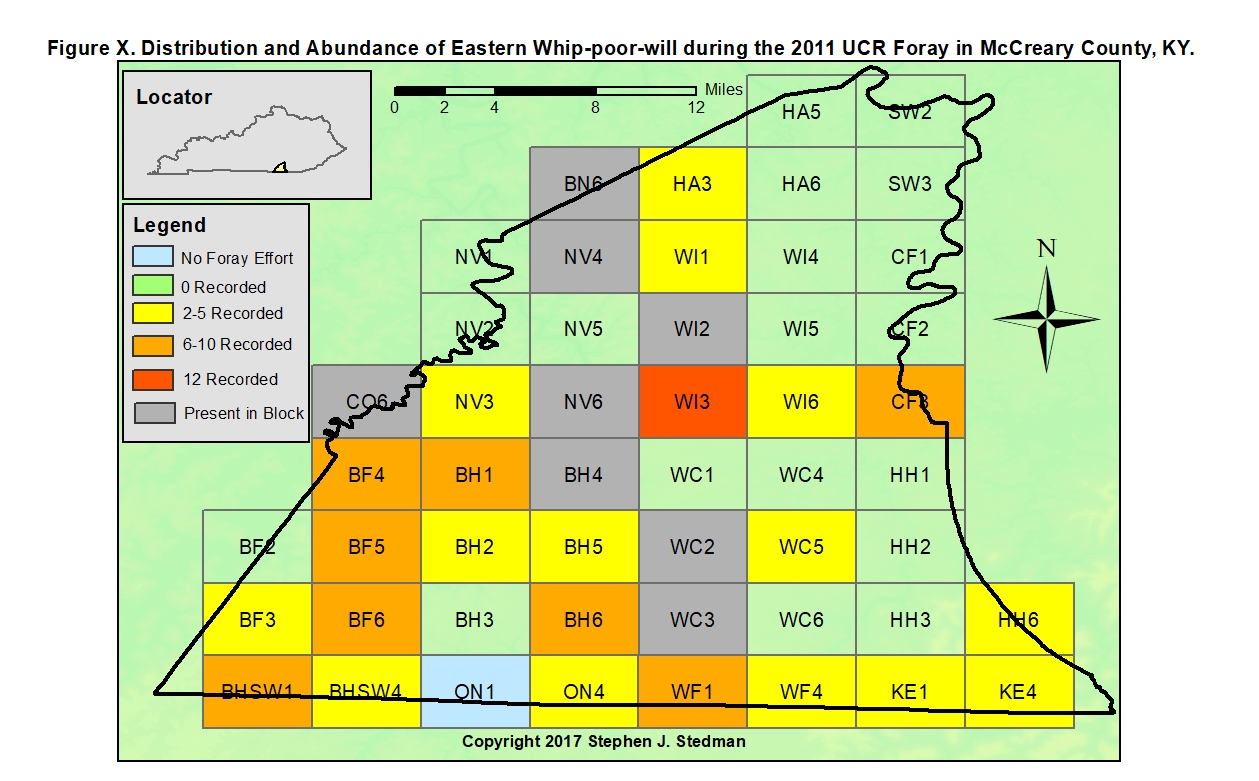
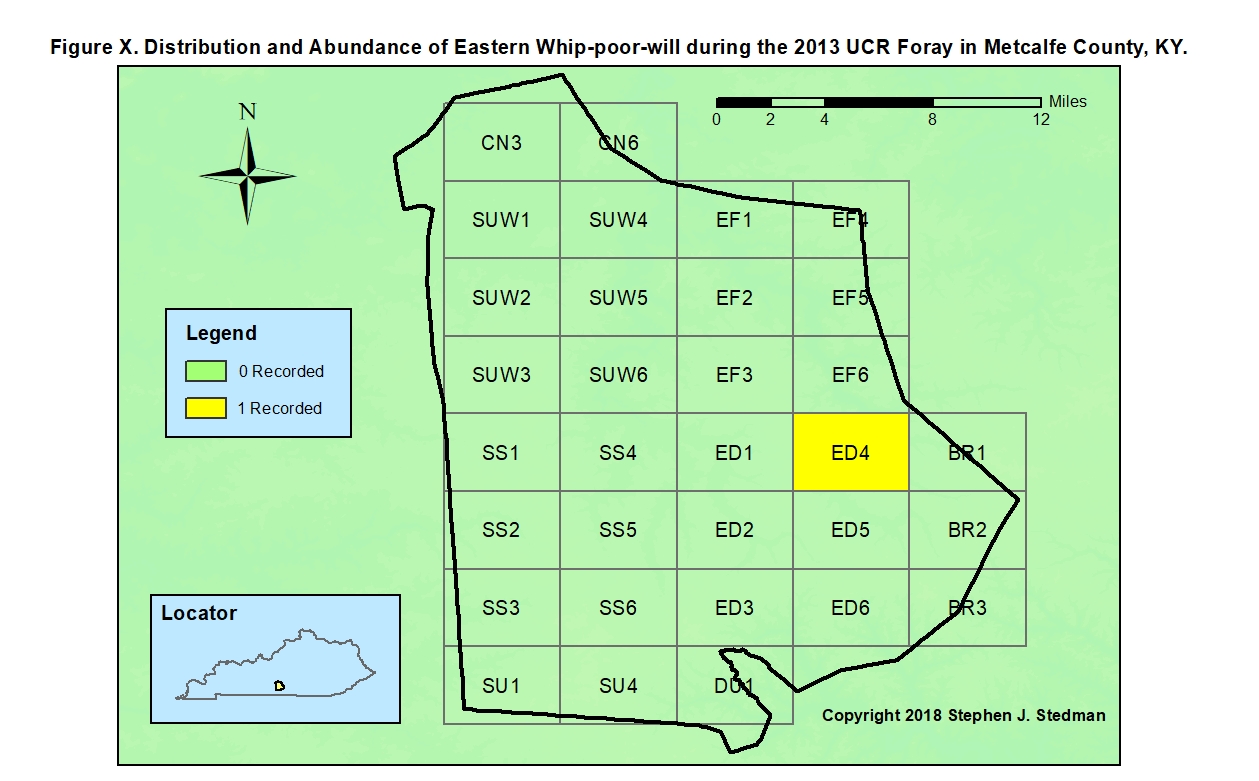
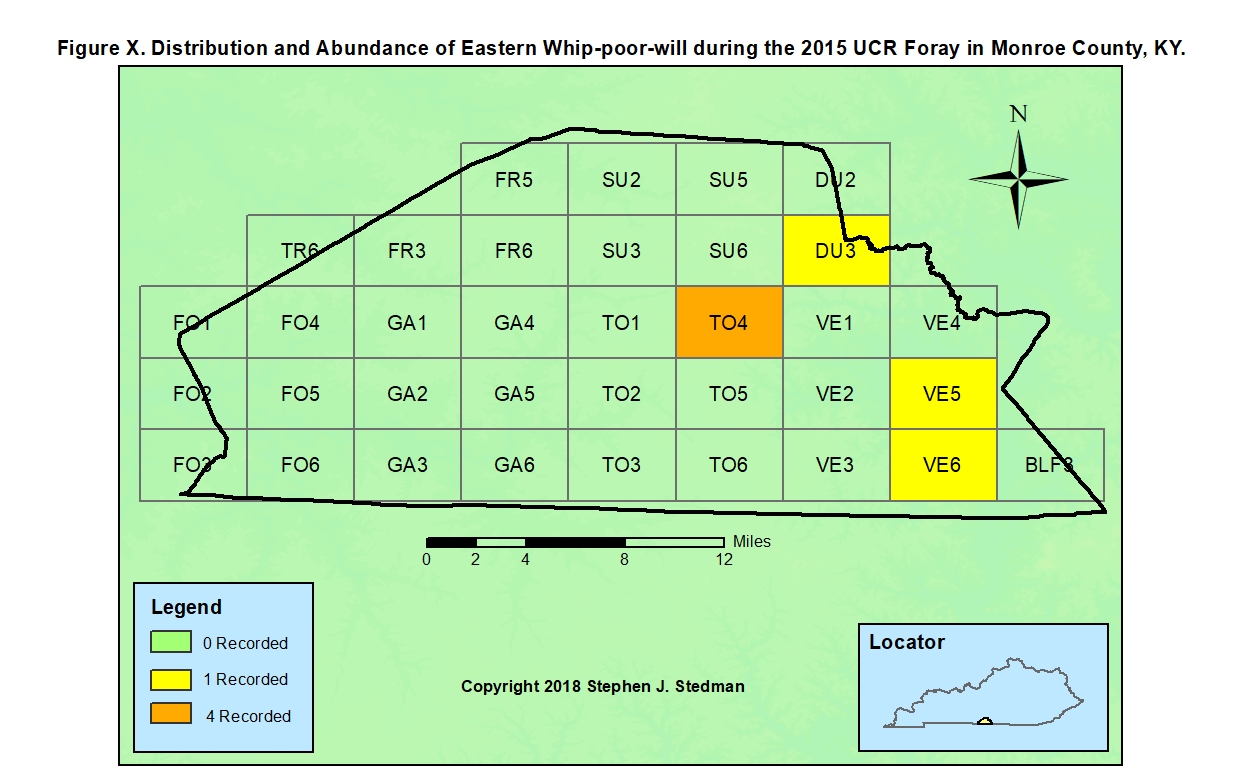
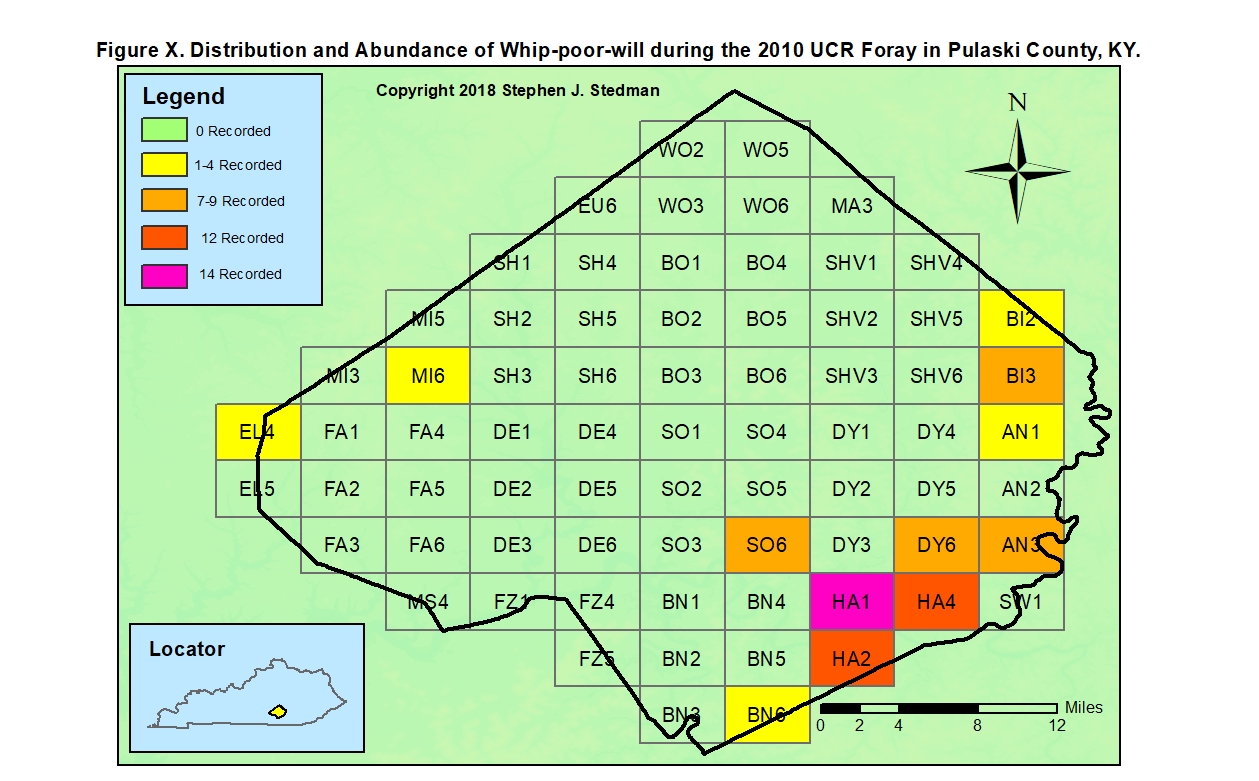
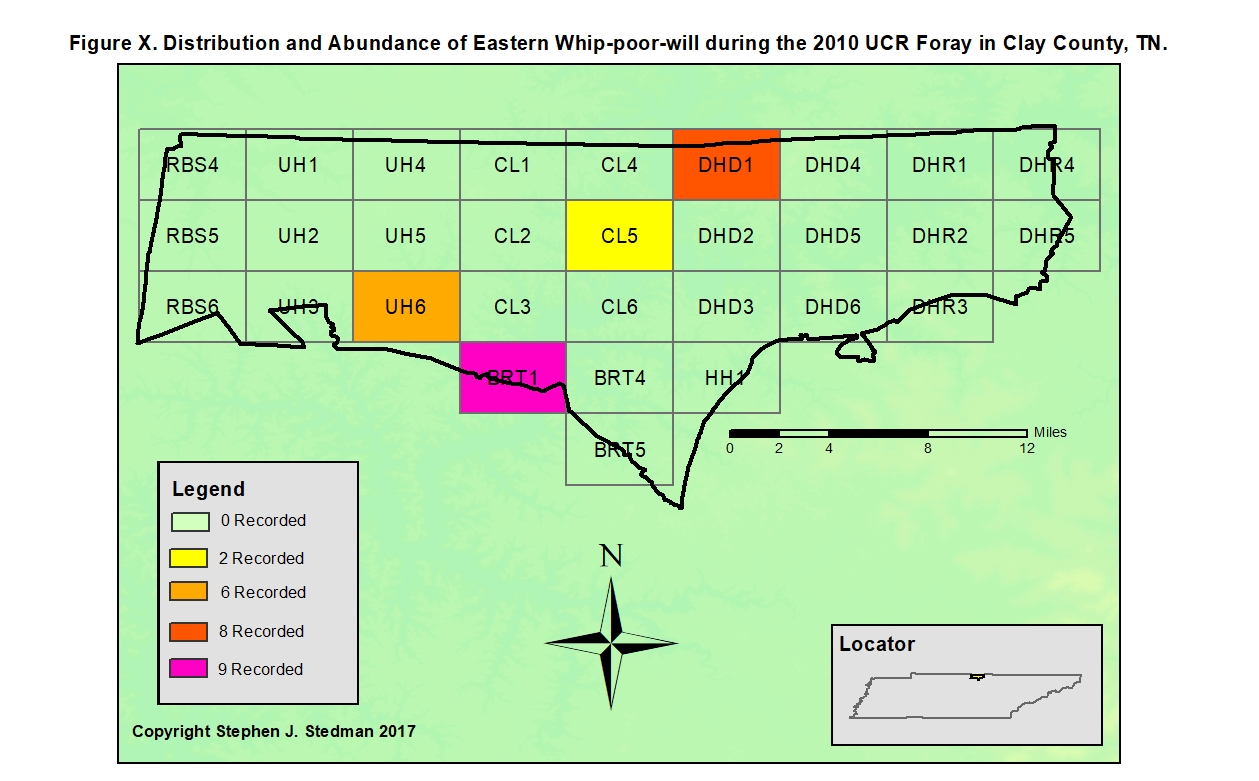
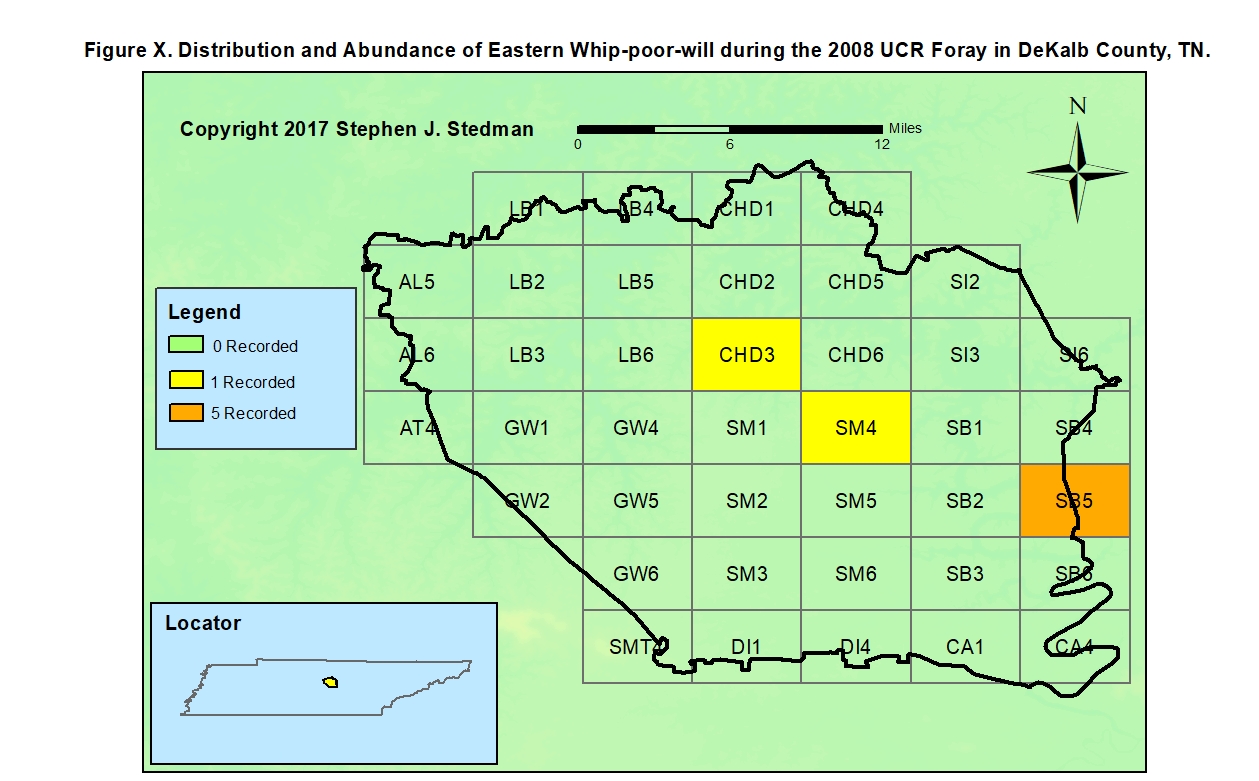
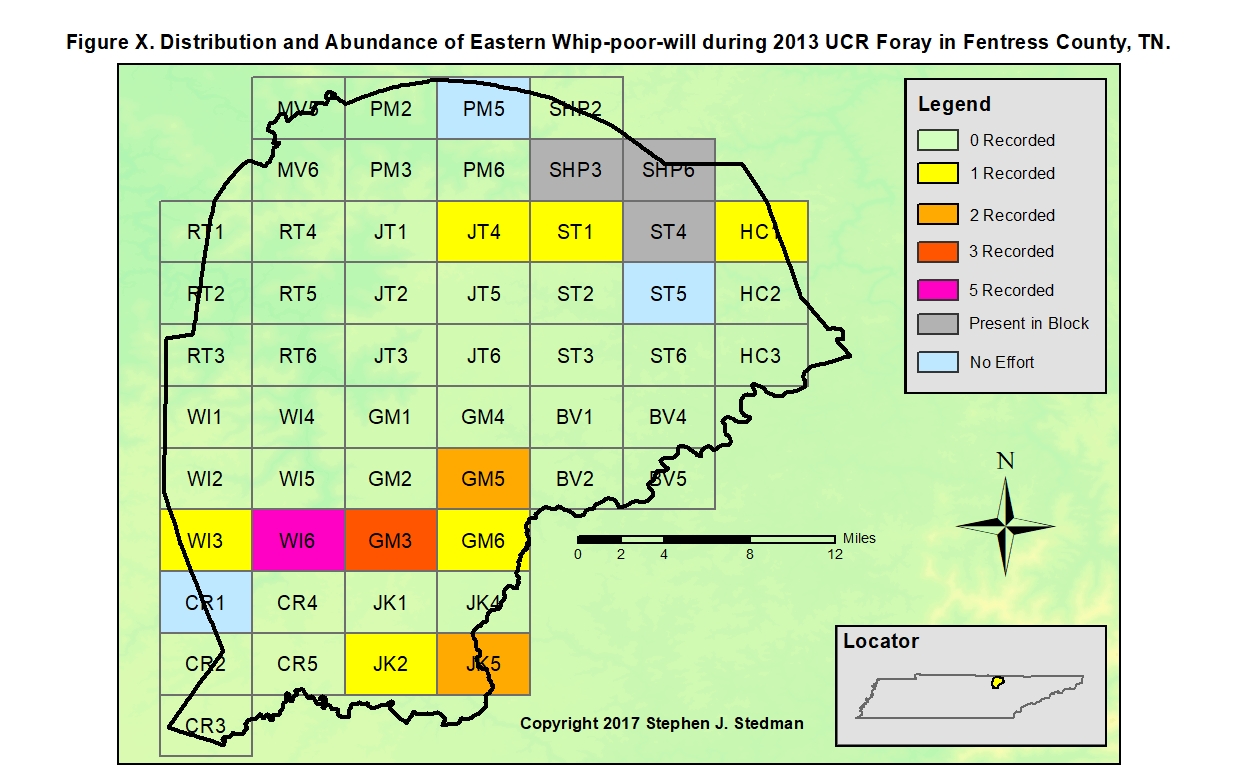
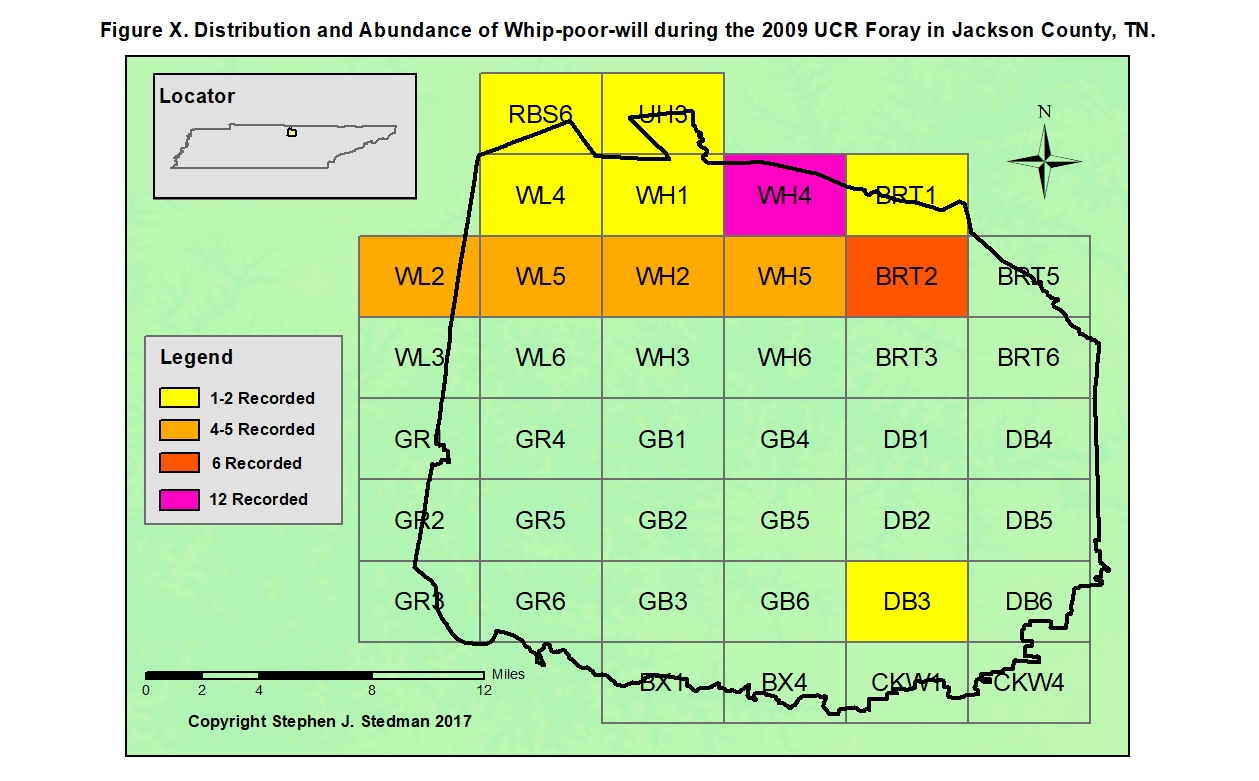
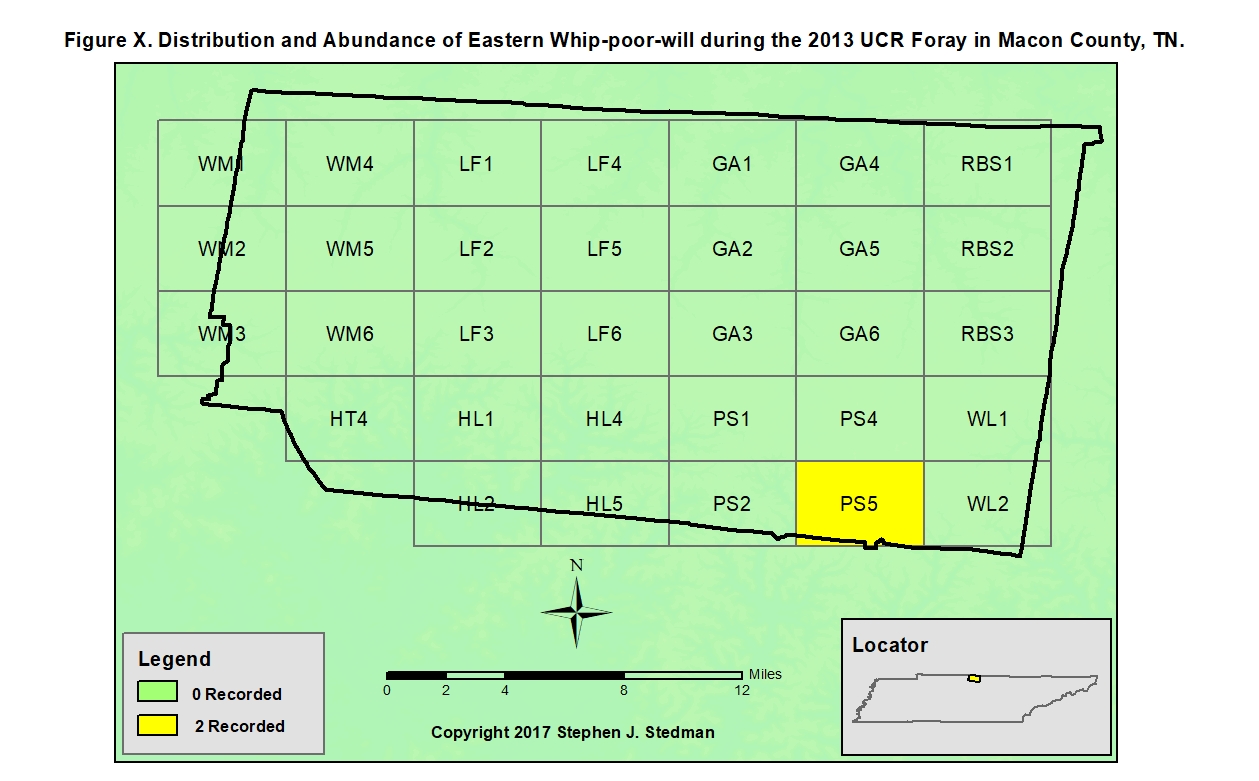
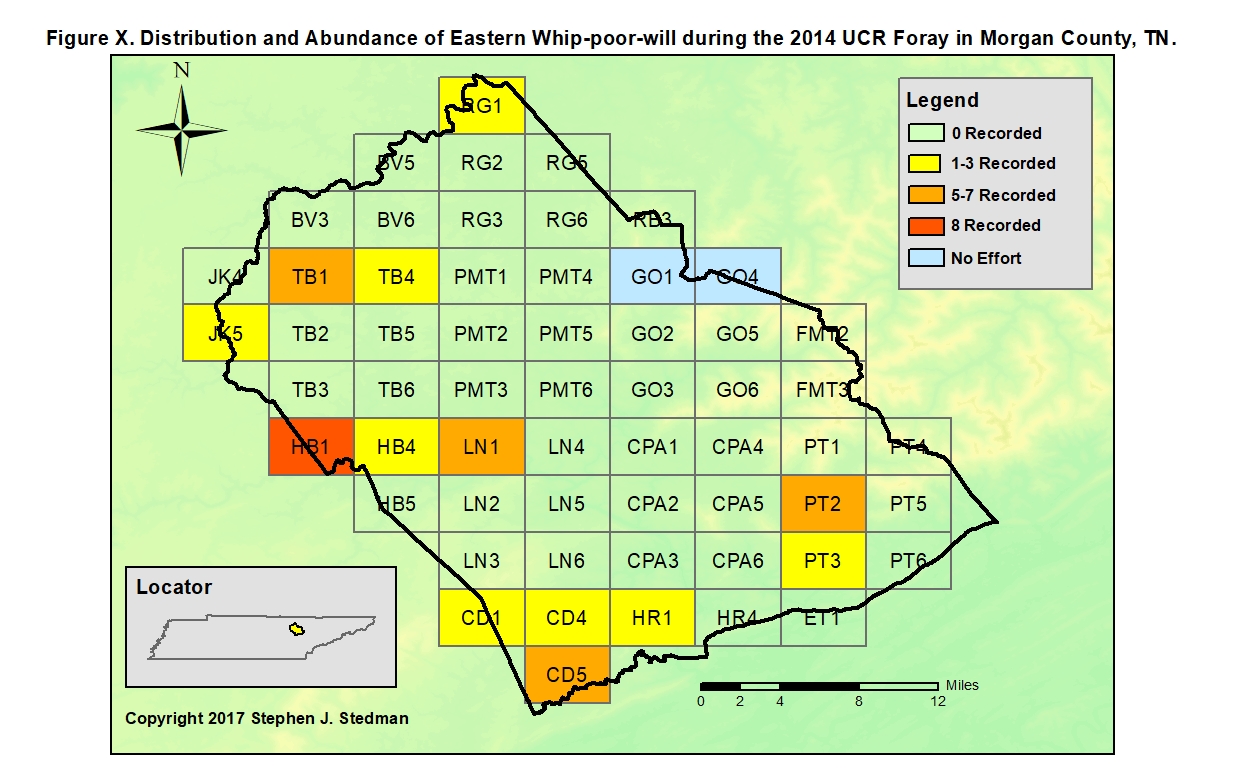
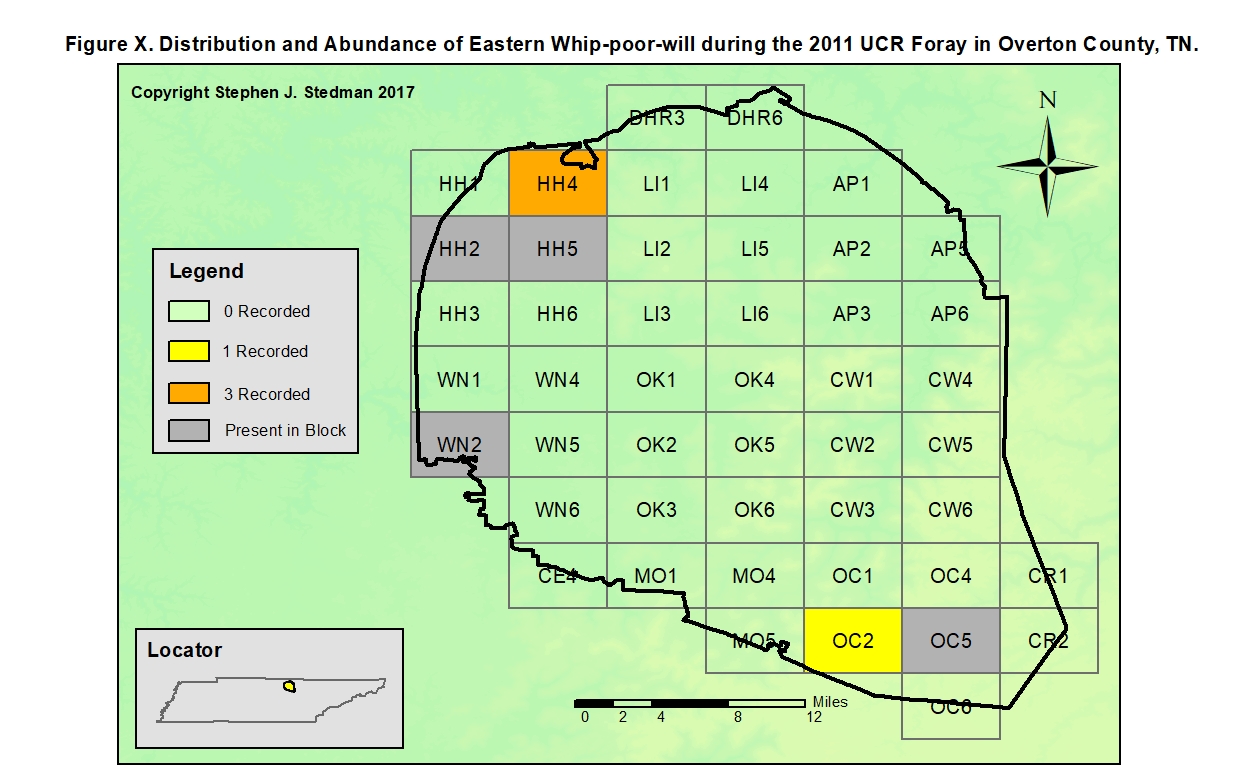
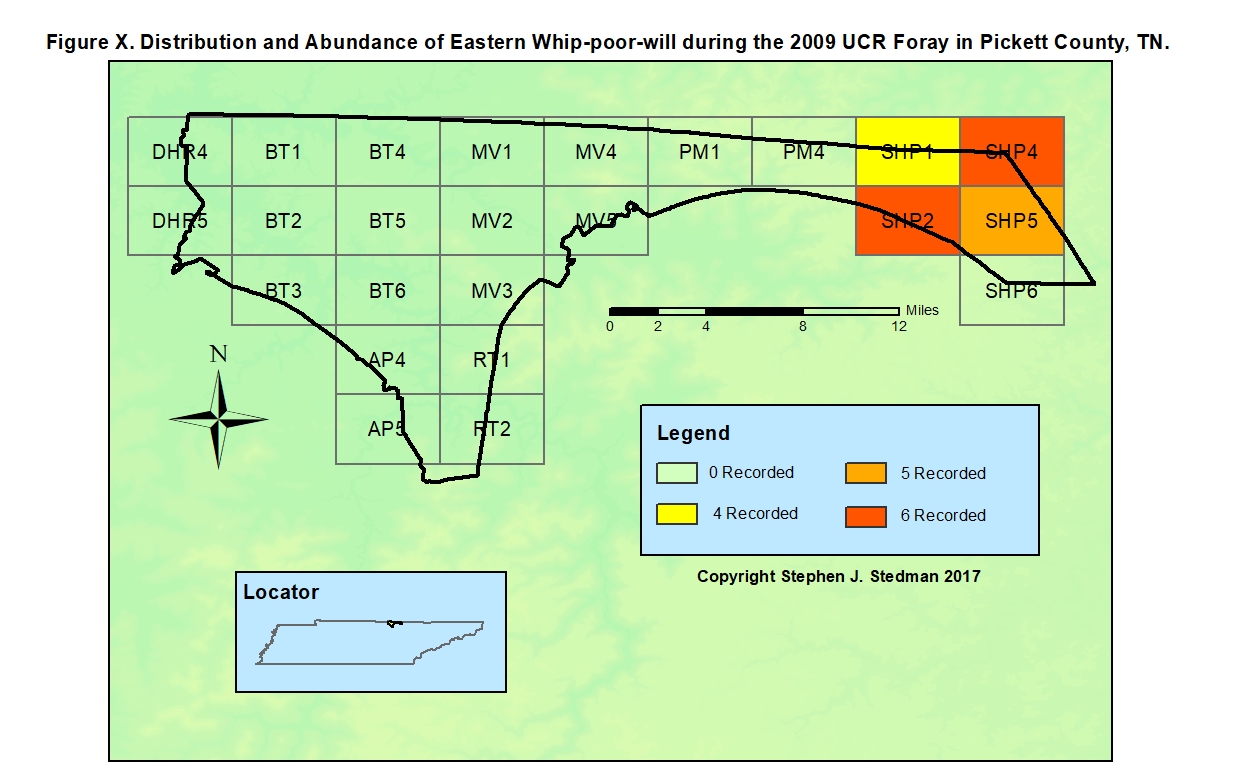
Foray Results: A summary of data from UCR Forays follows (to view a map displaying foray data for a county or a sub-Region for this species, click on the name of an underlined county or state below):
| County | Dates when Foray Conducted | Total
Blocks in County * |
Total
Blocks in which Eastern Whip-poor-will Recorded |
Total
Individuals Recorded |
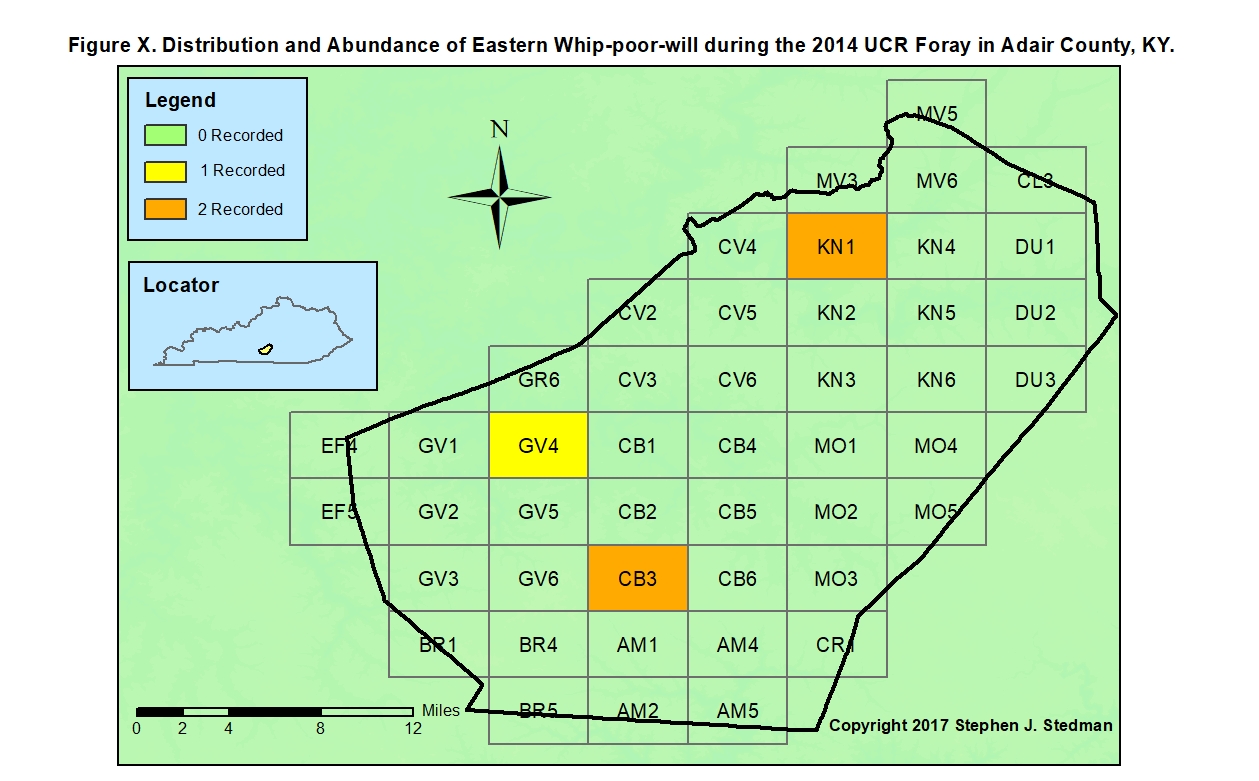
| Adair | 8–16 June 2014 | 46 | 3 | 5 |
| Barren | 1–6 June 2013 | 54 | 0 | 0 |
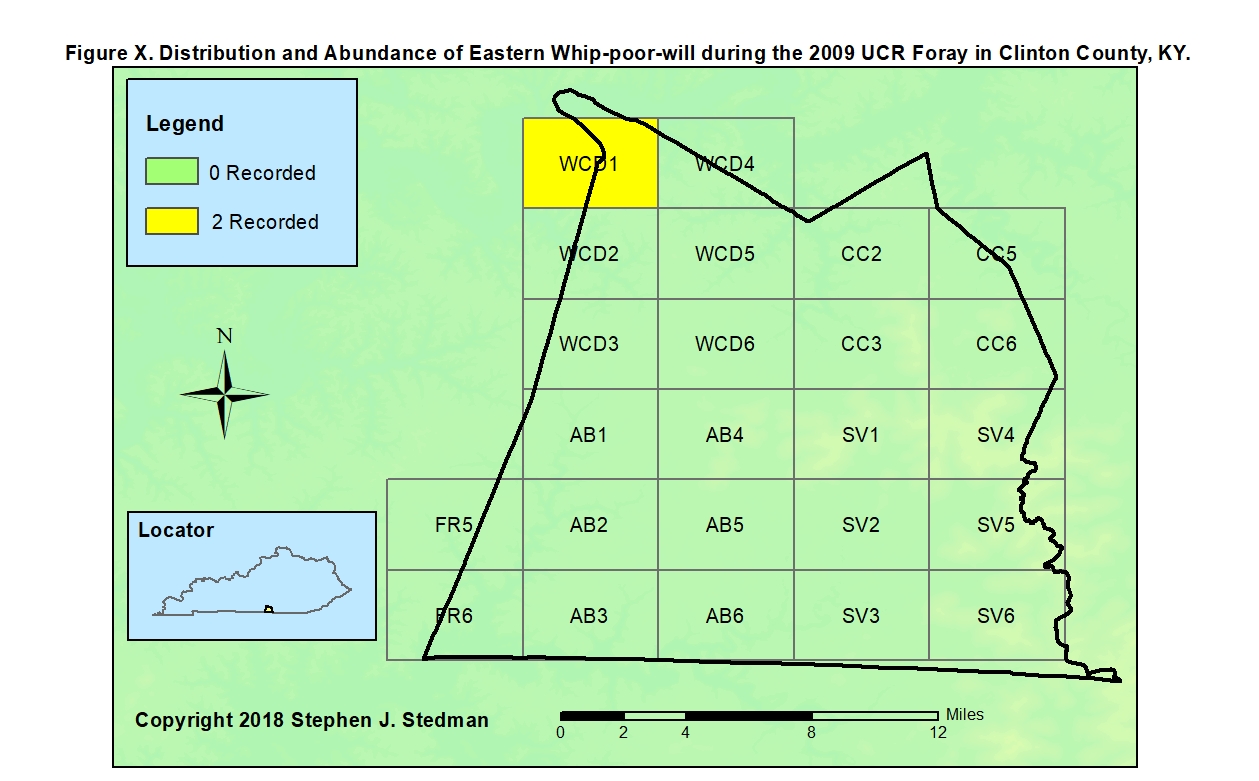
| Clinton | 12–14 June 2009 | 24 | 1 | 2 |
| Cumberland | 16–20 June 2014 | 35 | 7 | 13 |
| McCreary | 30 May–5 Jun 2011 | 51 | 31 | 129 |
| Metcalfe | 8–12 June 2013 | 32 | 1 | 1 |
| Monroe | 1–12 June 2015 | 35 | 4 | 7 |
| Pulaski | 5–11 June 2010 | 72 | 12 | 81 |
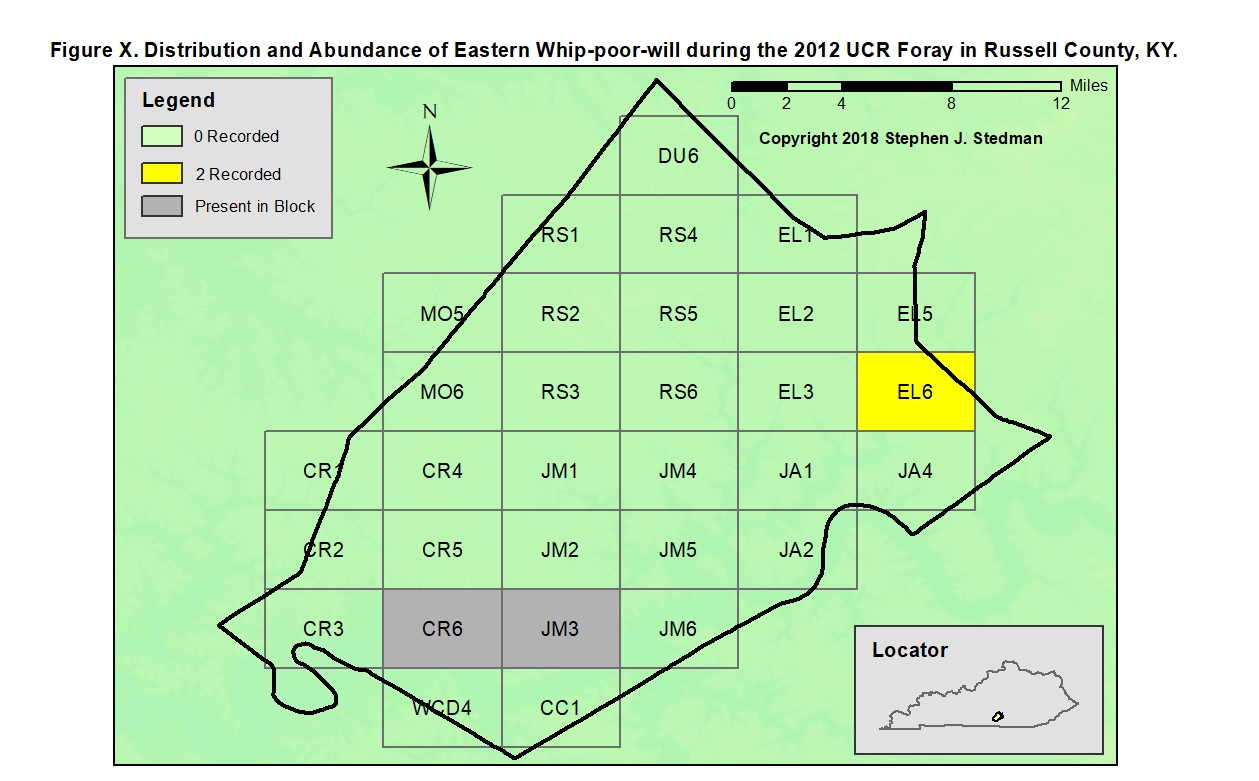
| Russell | 13–16, 26–29 June 2012 | 31 | 3 | 2 |
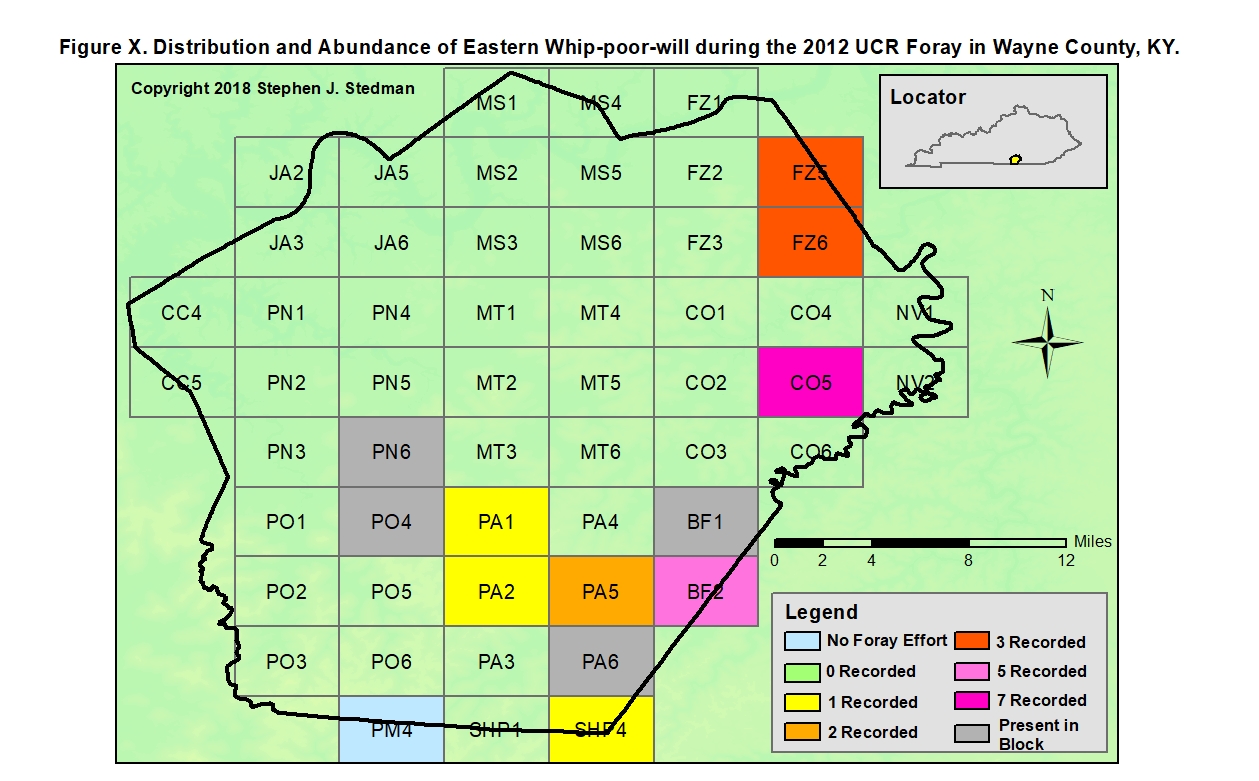
| Wayne | 28 May–3 June 2012 | 54 | 12 | 23 |
| Kentucky | 434 (408) | 74 (17.1%) | 263 | |
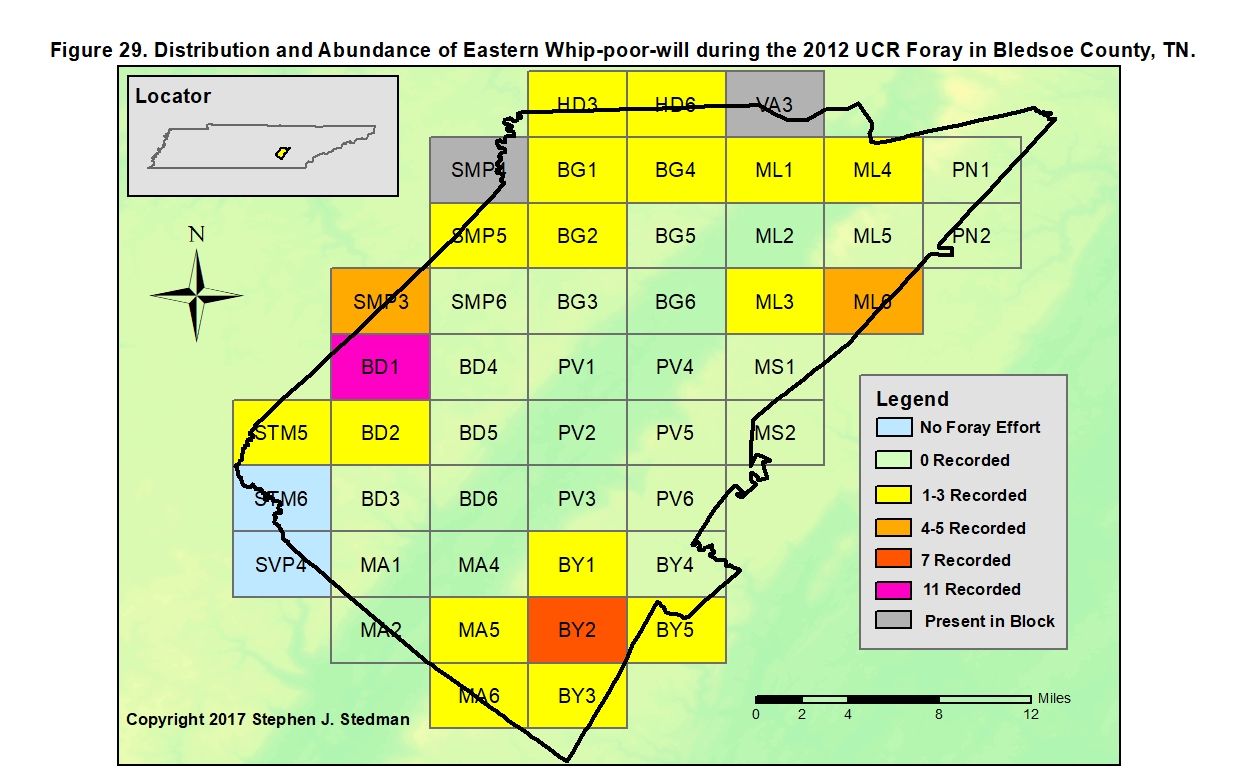
| Bledsoe | 18–24 June 2012 | 48 | 22 | 57 |
| Clay | 12–15 June 2010 | 30 | 4 | 25 |
| Cumberland | 29 May–4 June 2010 | 75 | 23 | 125 |
| DeKalb | 23–26 May 2008 | 40 | 3 | 7 |
| Fentress | 11–17 June 2012 | 55 | 13 | 18 |
| Jackson | 29 May–1 Jun 2009 | 40 | 12 | 45 |
| Macon | 17–22 June 2013 | 32 | 1 | 2 |
| Morgan | 1–8 June 2014 | 58 | 13 | 48 |
| Overton | 23–29 May 2011 | 47 | 6 | 4 |
| Pickett | 22–25 May 2009 | 24 | 4 | 21 |
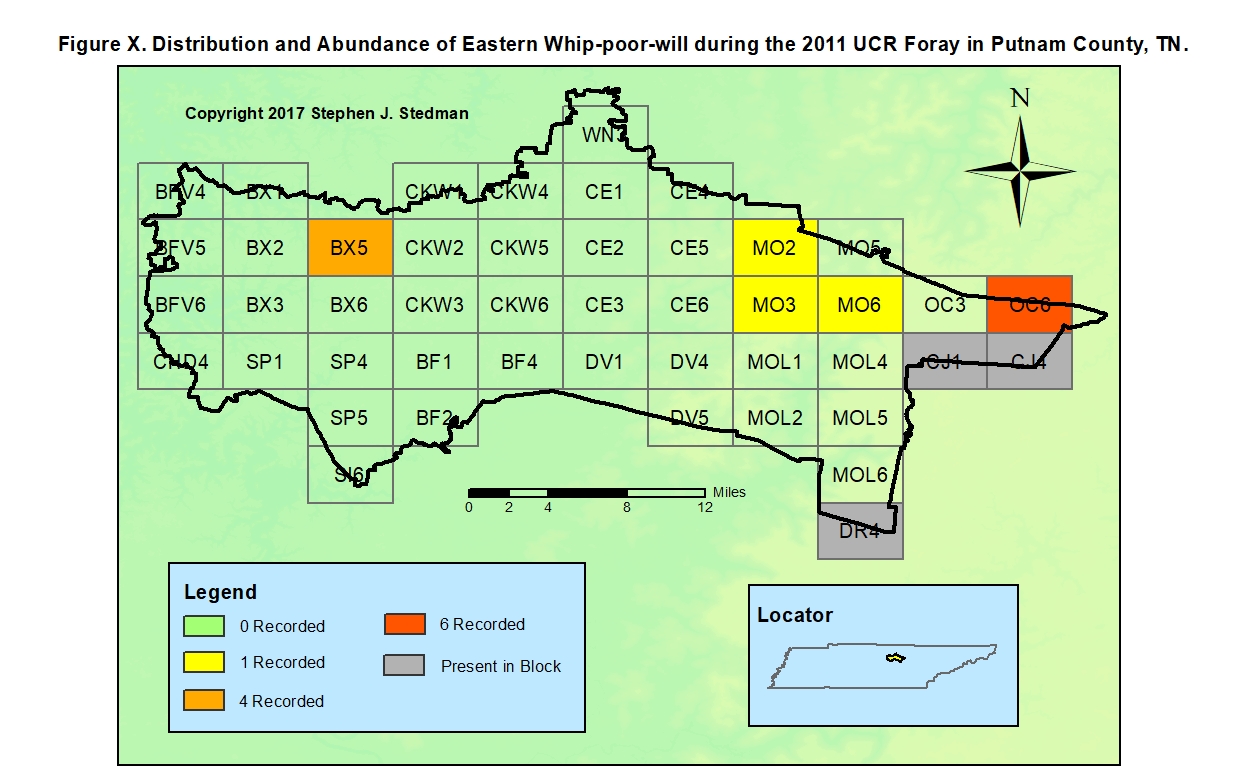
| Putnam | 6–12 June 2011 | 46 | 8 | 13 |
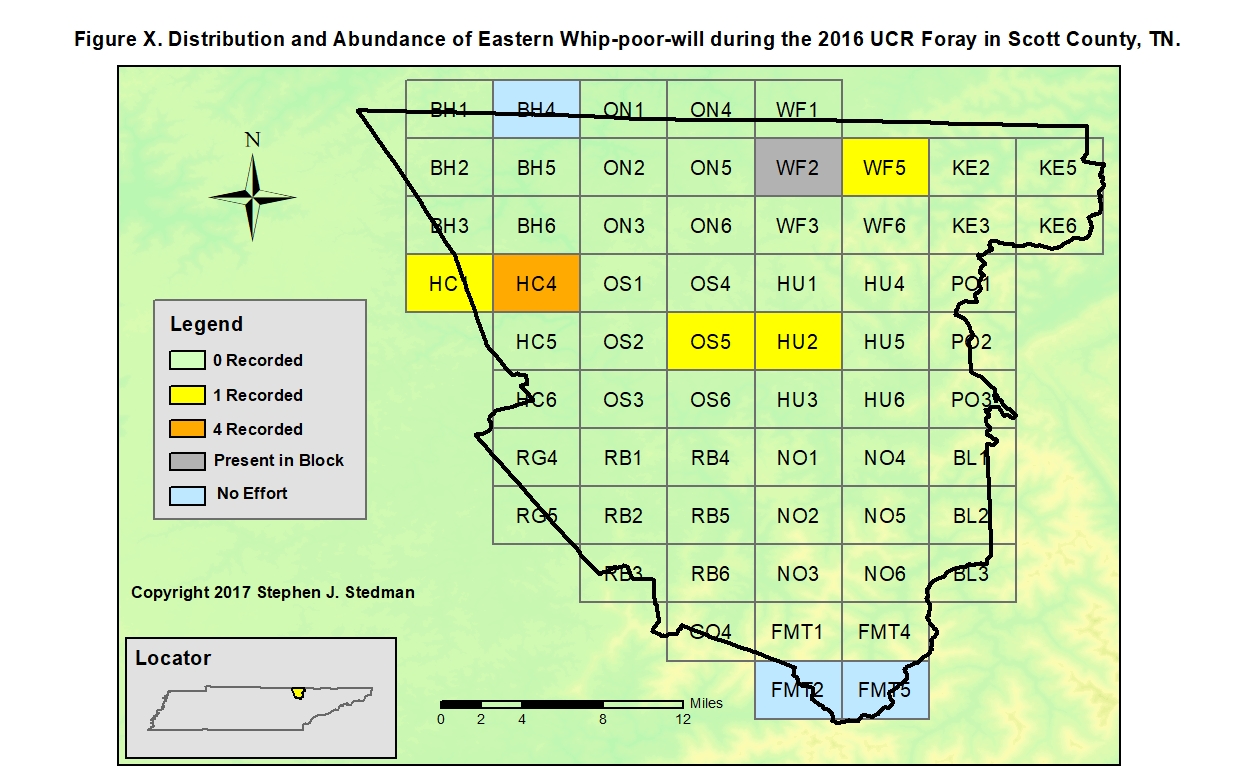
| Scott | 9–24 June 2016 | 62 | 6 | 8 |
| Smith | 15–25 June 2015 | 37 | 0 | 0 |
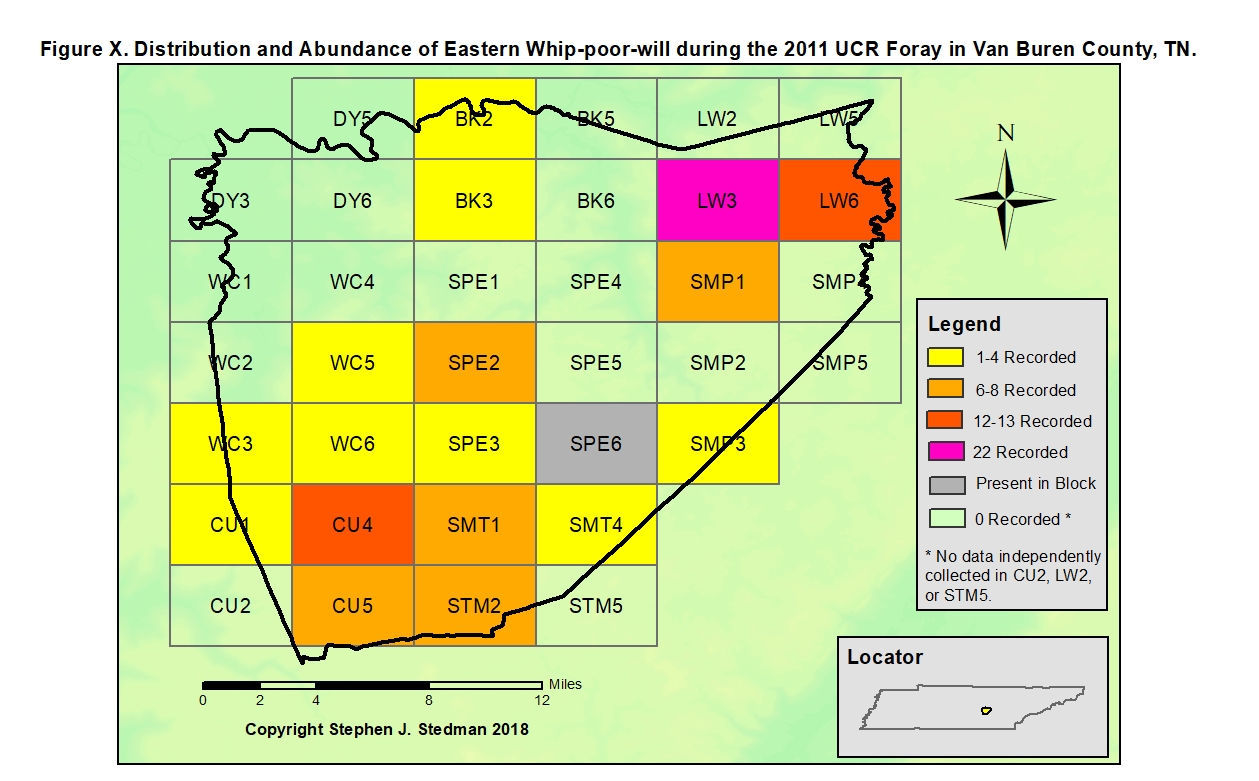
| Van Buren | 13–15 June 2011 | 33 | 18 | 99 |
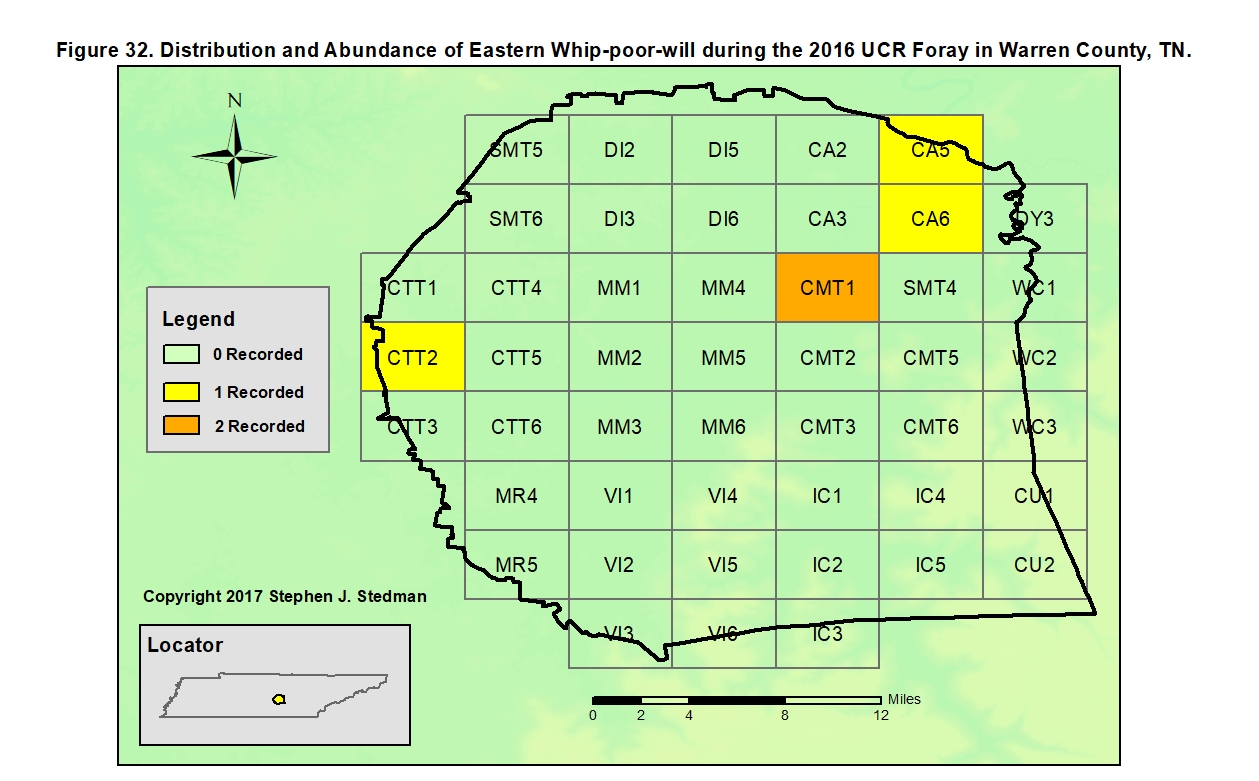
| Warren | 1–10 June 2016 | 47 | 4 | 5 |
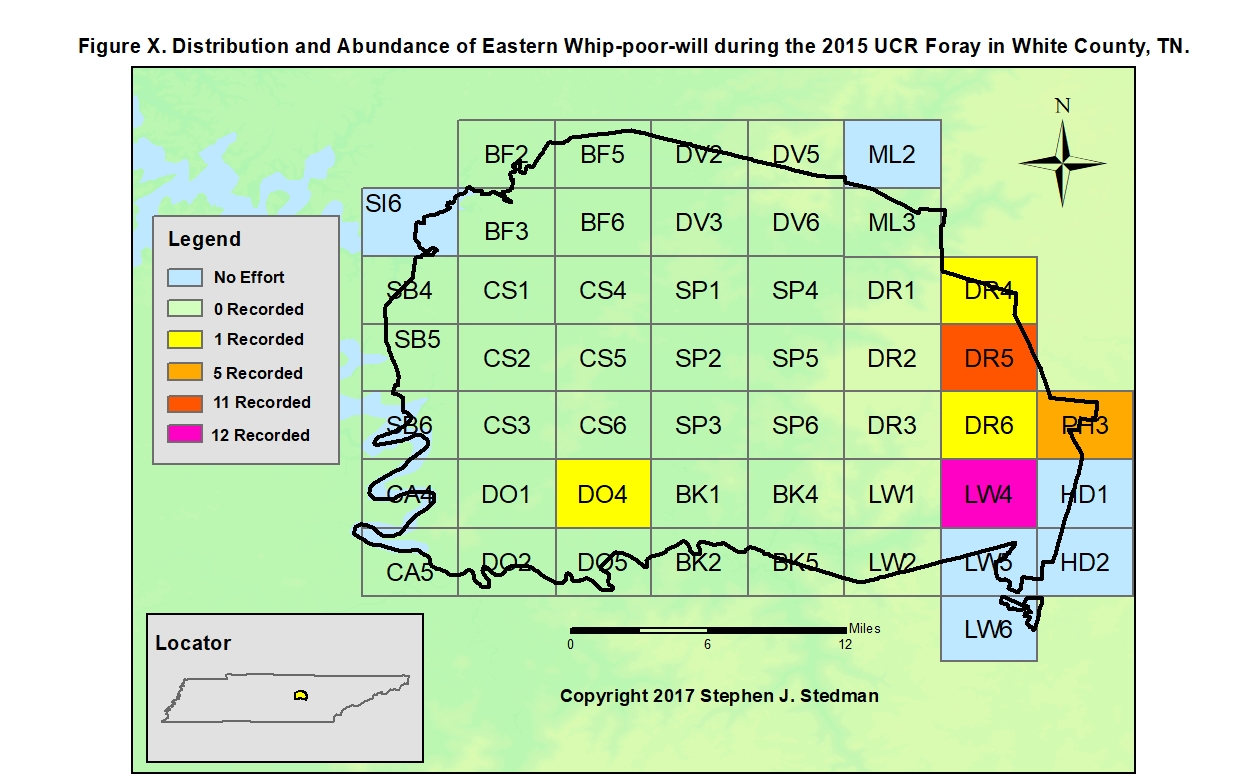
| White | 1–6 June 2015 | 50 | 6 | 31 |
| Tennessee | 724 (651) | 143 (19.8%) | 508 | |
| Region | 1158 (c.1059) | 217 (18.7%) | 771 |
* Because some foray blocks fall into two or three counties, the total of blocks in the Kentucky or Tennessee portions of the Region is less than the sum of the blocks in the counties of each portion of the Region; similarly, because some blocks fall into both states, the total of blocks for the Region is less than the sum of the blocks in the two states.
Remarks: Few monitoring projects directed at the nightjars have been conducted in the Region, the longest being conducted in the Big South Fork National River and Recreation Area from 1997–2006 (Link). Thirty stops of 3 minutes each were conducted during pre-dawn hours, leading to counts of Eastern Whip-poor-wills that ranged from 37 to 65; some of the variability in the data was probably related to differing weather conditions on the dates when the counts were made; some variability may have been due to differing moonlight conditions on those dates.
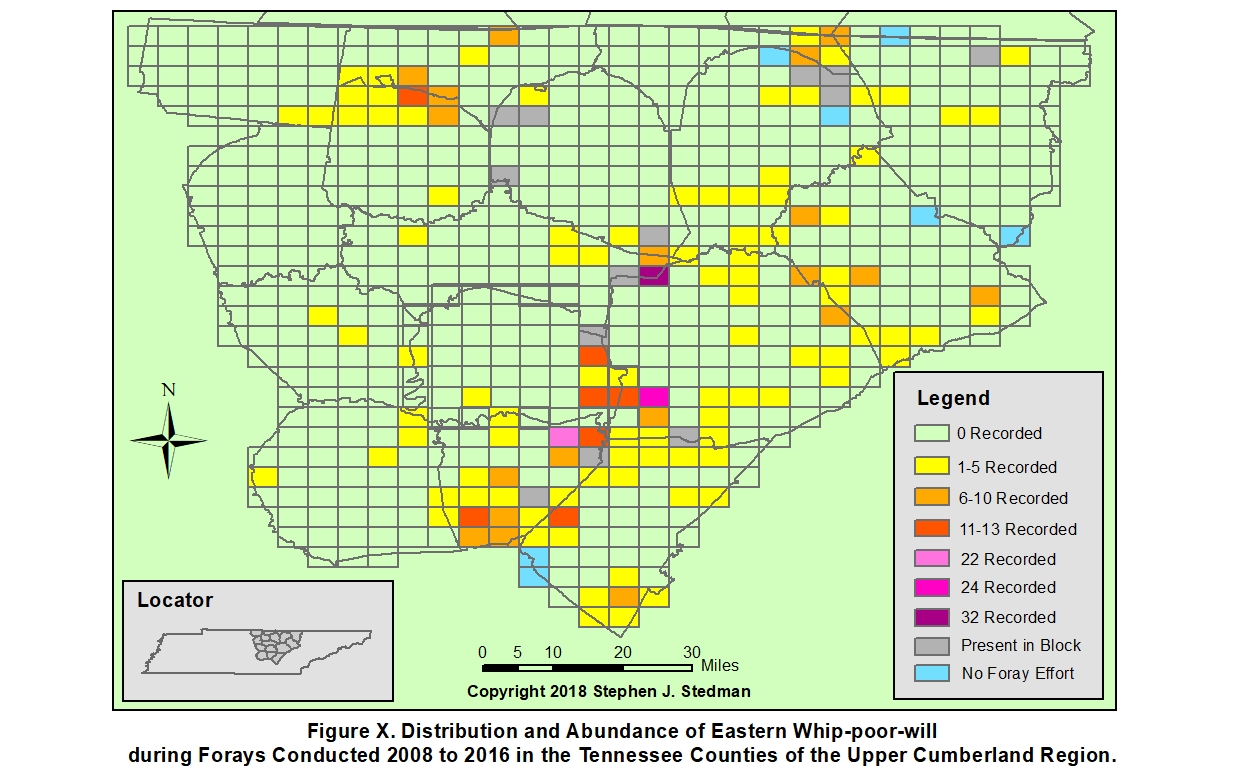
Foray data (see above) collected 2008-2016 in both the Kentucky and Tennesee parts of the Region provide at best a somewhat obscured window through which to view the status of this fine species. Data from the Kentucky and Tennessee atlas projects provide perhaps even more obscured windows through which to view that status. Results from both atlas projects and from the foray project were hampered by lack of sufficient night work to collect the data needed to determine the current status of this species at the times of those surveys. BBS data from the eight routes conducted in the Region are also too few to generate helpful views of that status. Thus, we are left to hope that the Regional status of the whip-poor-will is at least no worse than its status continentally, which as of 2008 was quite negative, the continental trend for the period from 1966 to 2008 being -2.2% per year (Ziolkowski et al. 2010).
Despite the overall somewhat spotty data deriving from the foray project and especially the atlas project, as well as the more gloomy data deriving from the continental BBS project, some good news may still be gleaned from the atlas and foray results with regard to the status of the whip-poor-will. For instance, during the Kentucky atlas project whips were recorded in just seven of the 408 blocks in the 10-county part of the Region in Kentucky, whereas during the foray whips were recorded in about 74 blocks (see above). Similarly, during the Tennessee atlas project whips were recorded in 51 blocks in the 16-county part of the region in Tennessee, whereas during the foray they were recorded in about 143 blocks (see above). Furthermore, the percentage of blocks in which this noctural songbird was recorded during the foray work in Kentucky and Tennessee was somewhat similar, with the whip being recorded in 17.1% of blocks in Kentucky and in 19.8% of blocks in Tennessee, a result suggesting that the populations of this nightjar occur at a roughly equivalent density in the two parts of the Region. It is also worth noting that whips were recorded in just 5 of ten counties during the Kentucky atlas but in 9 of 10 counties during the foray there; similarly, whips were recorded in 13 of 16 counties in Tennessee during the atlas while being recorded in 15 of 16 counties during the foray there.
The maps resulting from the foray project for whip-poor-will provide a rough indication of the general density of this species in the Kentucky and Tennessee parts of the Region. The Kentucky composite map reveals a much denser population on the Cumberland Plateau in the easternmost part of the Region than in the counties to the west of that landform. The Tennessee composite map provides a hint of the same difference, but that map is much less clear-cut in its depiction of this difference in the populations on and west of the plateau.
Check-lists of Birds for the Counties of the UCR
Check-lists of the birds of each county of the Upper Cumberland Region may be viewed by clicking on the links below. For each county, there are two check-lists: one list that shows the species that have been observed and where possible documented in the county within the larger list for the entire Region; and one list that includes only the species observed in the county with annotations for the date and observers for at least one sighting (the ultimate goal of the latter list will be to include annotations for the very first known Regional observation of each species in that county; this goal is probably one that will take many years to complete, if completion is even a possibility). To see if the species discussed in this species account has been observed in a county, click below or click on the link for the Map of UCR Distribution near the top of the page.
| Barren | Metcalfe | Adair | Russell | Pulaski |
| Monroe | Cumberland | Clinton | Wayne | McCreary |
| Macon | Clay | Pickett | Fentress | Scott |
| Smith | Jackson | Overton | Putnam | Morgan |
| DeKalb | White | Cumberland | ||
| Warren | Van Buren | Bledsoe |
Check-lists of Birds for Some Public Access Birding Sites of the UCR
Check-lists of the birds of some public access birding sites within the Upper Cumberland Region may be viewed via the links below. To see if the species dealt with in this species account has been observed within any of these sites, click on the appropriate link below. See the pages for each county within the Gazetteer for links to additional smaller public access birding sites with check-lists in progress.
Literature Cited
 Foray--WPWI.jpg)
%20Foray--WPWI.jpg)